Chapter 2. Five Platforms, One Language
Johnson
2026-08-15
More than 100 human and mouse kidney spatial datasets were generated from 5 different platforms. To make these datasets comparable, we need to unify them into a single framework. The unification process involves several steps, each with its own considerations and trade-offs. Now let’s go through the unification process to see “how variable” the raw data looks like and “how it is unified”.
The resolution ladder
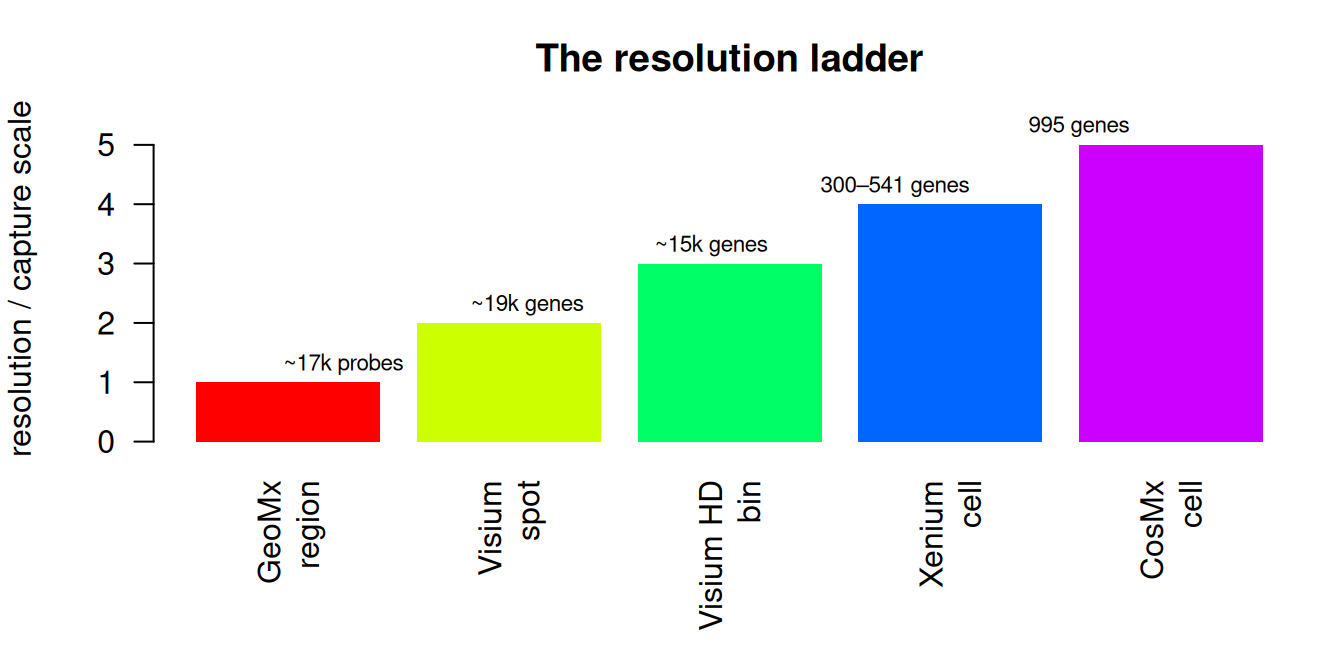
I organize the platforms into resolution tiers: GeoMx region → Visium spot (~55 µm) → Visium HD bin (8 µm) → Xenium/CosMx cell. Each tier is a different answer to the same question, “what is the kidney made of, and where?”, at a different granularity, and each tier trades resolution against coverage. The ladder is the conceptual spine of this analysis: every subsequent chapter climbs or descends it.
What unification required
Making 128 samples comparable took four deliberate, documented steps, each of which leaves its trace in the data:
A canonical schema. Every sample was normalized to one AnnData structure: raw counts in
X, metadata and QC inobs, spatial coordinates inobsm['spatial'], and a resolution tier tag. A GeoMx ROI and a CosMx cell now live in the same file format, clearly labeled.A common coordinate frame, where the data allow it. Visium pixel coordinates were converted to microns using each sample’s embedded spot-diameter scale factor (px per 55 µm spot). Xenium and CosMx coordinates are already in microns. Visium HD pixels were treated as ≈1 µm/pixel, an approximation. The HD scale factor is not a reliable micron proxy, so HD spatial distances are approximate, and any cross-platform distance comparison involving HD is accordingly qualified.
A resolution tier per sample. GeoMx has no coordinates at all; it is ROI-level by construction. No amount of effort adds a spatial graph to a region profile.
A per-species pipeline. Mouse and human gene naming and biology differ; the two species were analyzed separately and meet only through module-level comparison.
The list above is the design, with which I utilized the AnnData and Scanpy stack to read every native format in the cohort (Space Ranger, Xenium, CosMx, GeoMx) and write it into the one schema.
What comparability costs
Every design decision has a price, and this one is no different. I want to state the costs explicitly, because they bound what the rest of this analysis can claim:
Gene-level discovery is platform-confined. A gene not on a Xenium panel is invisible to the Xenium arm, no matter how important it is. The whole-transcriptome arms (Visium, Visium HD) carry the discovery weight; the panel arms carry the single-cell resolution.
Approximate HD scaling. As above, Visium HD coordinates are ≈1 µm/px. Fine for within-sample structure; coarse for cross-platform geometry.
GeoMx has no spatial graph. No neighborhoods, no domains, no diffusion; region-level scoring only. It participates in the atlas, but not in the spatial analyses.
Batch and species are real. Twenty-six human Visium samples come from different studies processed at different times; batch effects are present. The framework handles them where it can (integration with batch as a covariate) and reports them where it cannot.
The upshot is that unification buys the ability to ask biological questions across every platform at once, the goal of a systems-level analysis, at the price of confining gene-level discovery to the platforms that measured the genes. I consider this a favorable trade, and the rest of this analysis is the evidence for why it pays off.